Catalogue PIGMA
Atlantic - CH07 - Fisheries Impact
Type of resources
Available actions
Topics
Keywords
Contact for the resource
Provided by
Years
Formats
Representation types
Update frequencies
status
Resolution
-
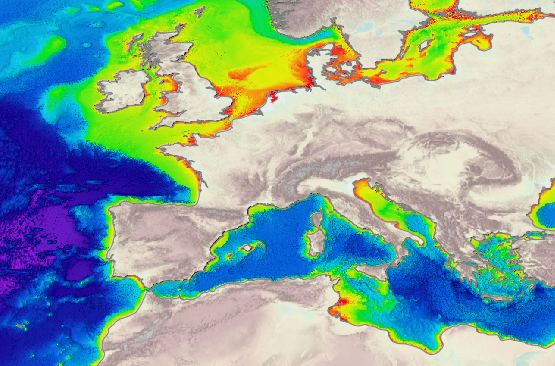
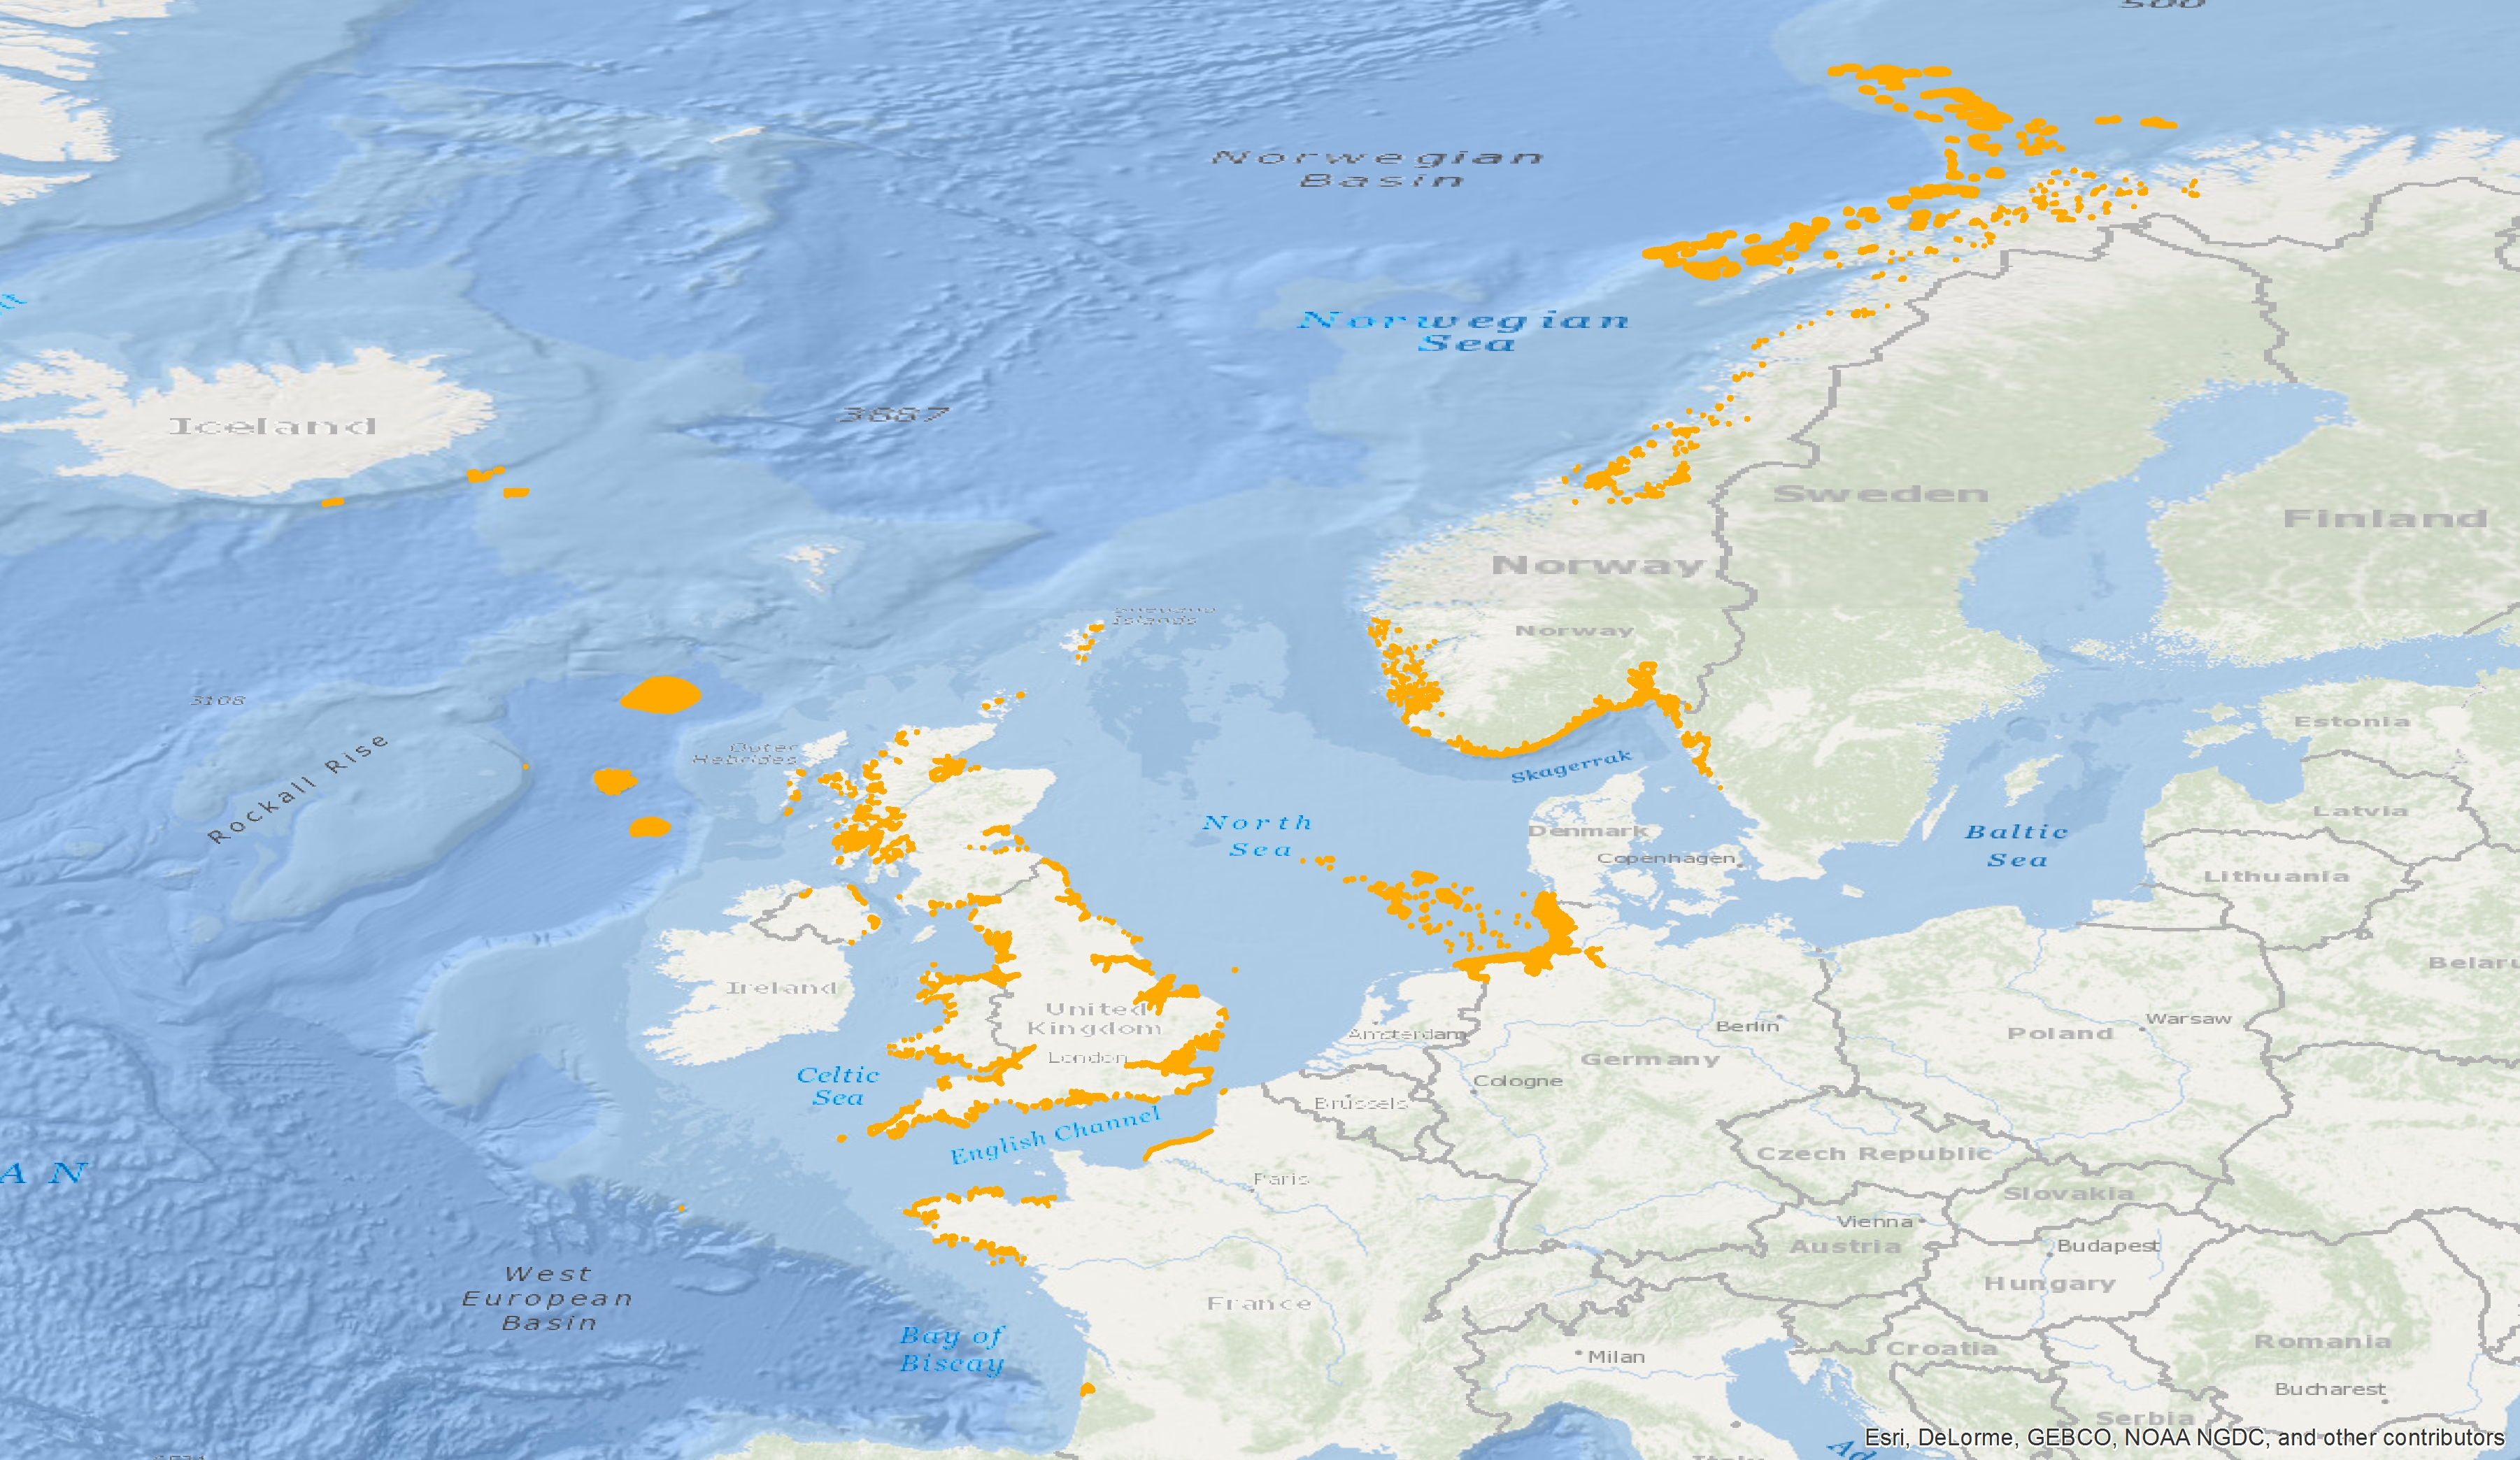
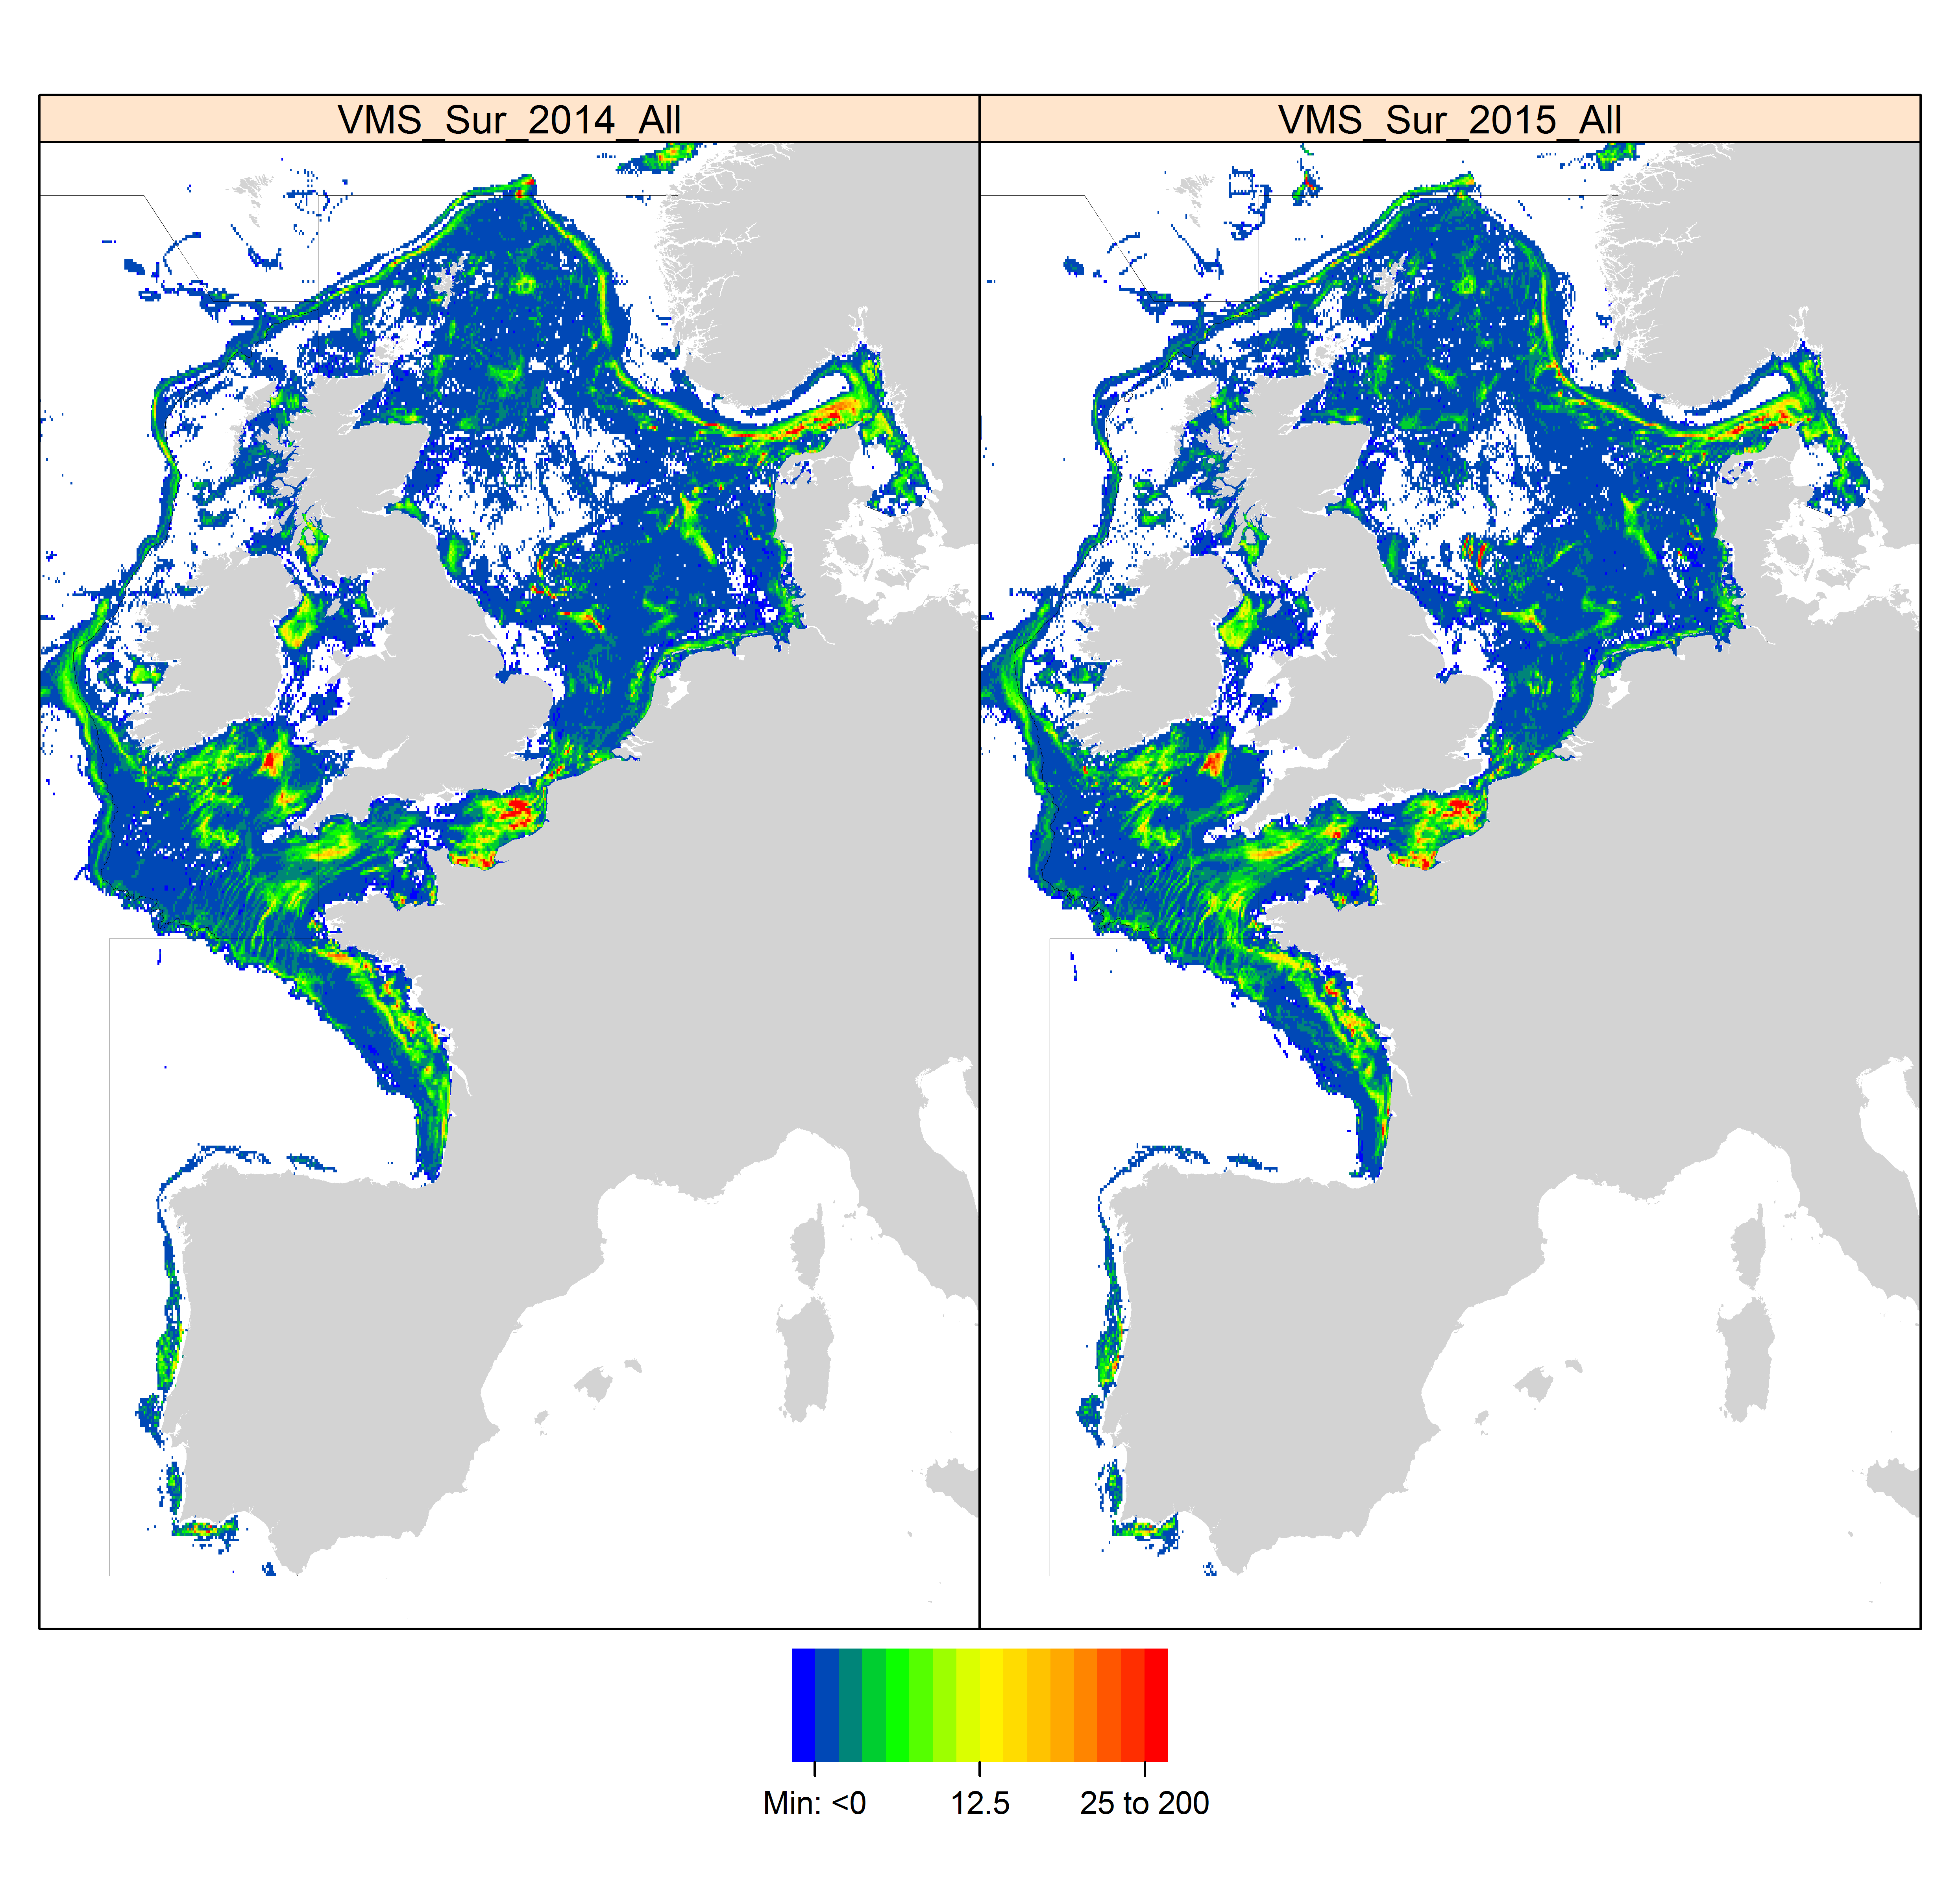
Data from a number of different sources have been integrated to provide new perspectives on fishing activities. Vessel Monitoring Systems (VMS) record and transmit the position and speed of fishing vessels at intervals of two hours or less. Fishing time can be calculated from the VMS data and combining this parameter with vessel logbook data, maps of fishing effort and intensity at different spatial and temporal scales can be calculated. The statistical software package “R” is used to extract the required information then re-interrogated to produce maps of fishing effort or intensity per month and year. The use of Automatic Identification System (AIS) data was not considered as combining AIS data with fisheries logbook data would pose issues namely; the ability of the AIS system to be switched off, only mandatory on vessels > 15 meters in length, cost involved to purchase data, and confidentiality.
-
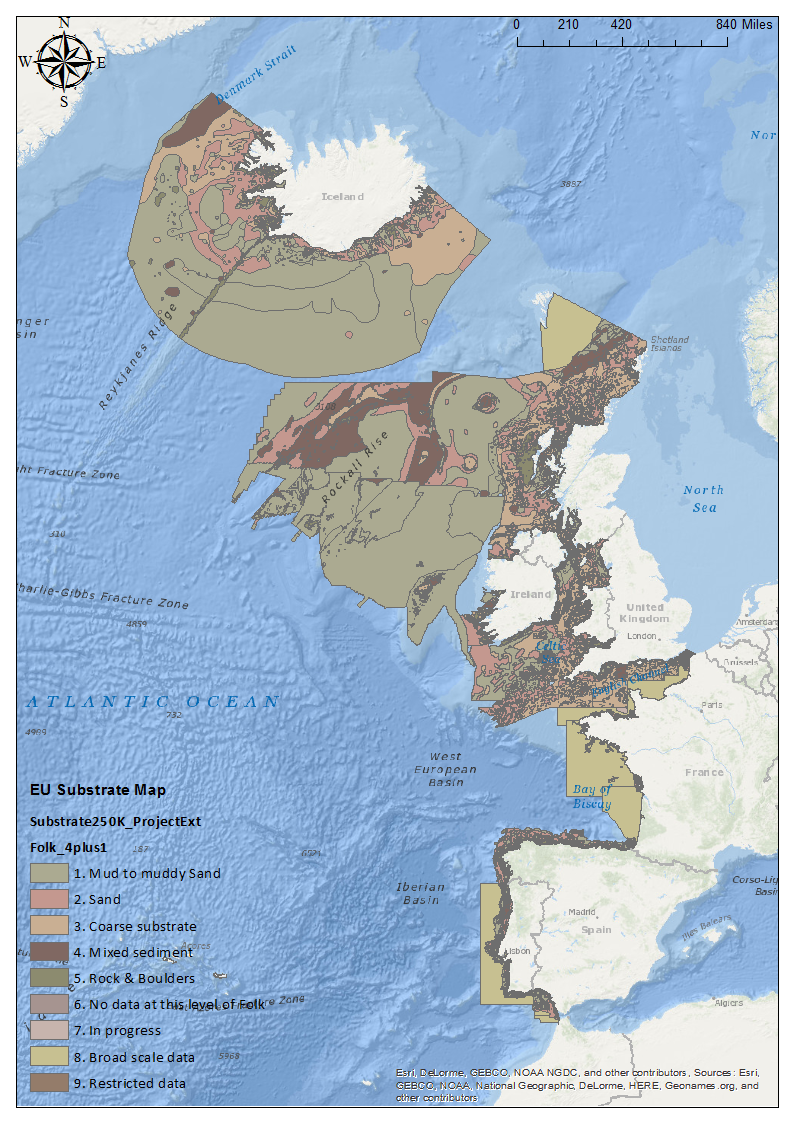
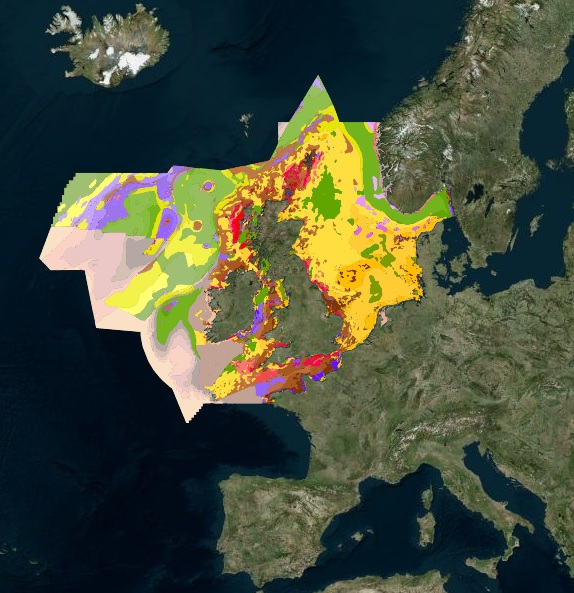
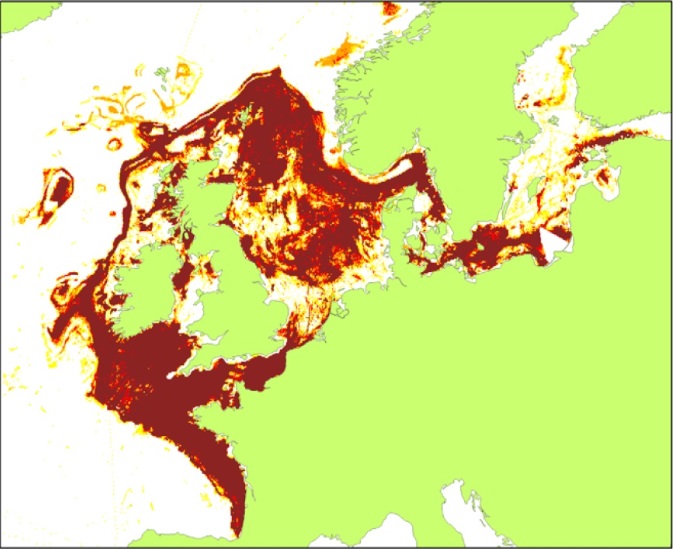
The impact of fishing on benthic habitats has previously been investigated however; a conclusive classification of potentially sensitive habitats per gear type does not exist. Currently only qualitative estimates of fishery impact using Broad-scale habitat maps are possible. Here a sensitivity matrix using both fishing pressure (fishing Intensity) and habitat sensitivity is employed to define habitat disturbance categories. The predominant fishing activities associated with physical abrasion of the seafloor area are from bottom contacting towed fishing gear. The swept area of the aforementioned gear in contact with the seabed is generally considered a function of gear width, vessel speed and fishing effort (ICES. 2015). The varying characteristics of fishing gear, their interaction with the sea floor and species being targeted; provide scope for differing interactions with subsurface (infaunal) and surface (epifaunal) dwelling communities. An evaluation of the abrasion pressure and habitat sensitivity split into surface and subsurface pressure allows greater insight to the ecological effects. Fishing intensity was calculated annually and based on the area of sea floor being swept (or swept area ratio SAR) by gear type. Calculations are based on SAR’s of gear types per area, per year. Fishing pressure ranks and habitat sensitivity ranks obtained from WGSFD working group (01 WGSFD - Report of the Working Group on Spatial Fisheries Data 2015) can be incorporated within a GIS environment to existing ICES fisheries data to provide habitat disturbance maps (fishing pressure maps+ habitat sensitivity maps) ICES. 2015. Report of the Working Group on Spatial Fisheries Data (WGSFD), 8–12 June 2015, ICES Headquarters, Copenhagen, Denmark. ICES CM 2015/SSGEPI:18. 150 pp.
-
-
-
-
-
-